Cash = Revenue? - Relation of Cash and Earnings.
Cash = Revenue?
Today’s topic was one of my very first lessons that I learned. Cash ≠ Revenue. What I mean by it is the net income amount that we see in the income statement, that we believe what the company has earned in that year is not the same as the cash company has received in that year. It may be less or more. And without cash the numbers on the Income statement is as fake as the Gucci sneakers or Rolex watches, which probably one of your friend flexes. The high earnings reported on TV or anywhere are to be researched and backed by cash. Hence it becomes necessary to see the relationship between the Income Statement and the Cash Flow Statement. Last time if you remember, I talked about sources of earnings by bifurcating the ROE = Net Profit Margin x Asset Turnover x Financial Leverage.Please read the previous blog, Quality Matters - Dupont Analysis, for context .Now we will talk about relation of those earnings with respect to cash.
Usually while comparing the income statement to cash flow statement, Net Income to CFO or EBITDA to CFO is used.
|
DMART |
2014 |
2015 |
2016 |
2017 |
2018 |
2019 |
|
NI |
161.37 |
211.69 |
320.26 |
491.67 |
787.78 |
902.54 |
|
CFO |
198.14 |
222.02 |
433.47 |
455.28 |
729.99 |
806.84 |
|
EBITDA |
341.78 |
458.99 |
663.61 |
981.12 |
1,352.81 |
1,633.29 |

In the above figure we can see the relation between the EBITDA, Net Income and CFO. Why should we look at these graphs and relations? Because we live in the world of accruals. Credit has power to break and make an entity, depending on it’s use. And by looking at these relations we are looking for unhealthy accruals. By this way, we probably will be to catch any frauds or discrepancies in the accounts as accounts could be twisted and misrepresented but cash is very difficult to twist or fake. All we look for is a stable relation between EBITDA, Net Income and CFO. As shown in the above graph, the Net Income and EBITDA have been stable for last 6 years. Although past is no guarantee of future, but we can get a good estimate that foreseeable numbers of NI and EBITDA are going to be stable with respect to each other. We also see the CFO is not bouncing crazily around the NI. Which shows the CFO is fairly stable for DMart and we don’t expect much of deviation from the NI. The reason for that is DMart don’t operate in an environment where there are high receivables or payables as compared to other Industries. Retail is simple model of business. And this stable CFO gives me, as an investor, confidence that the business is earning cash without too many accruals and DMart has the ability to generate stable cash from its operational activities itself.
|
KPD |
2014 |
2015 |
2016 |
2017 |
2018 |
2019 |
|
NI |
92.04 |
65.32 |
58.9 |
87.18 |
121.48 |
75.4 |
|
CFO |
-116.99 |
34.36 |
36.43 |
142.63 |
229.75 |
67.42 |
|
EBITDA |
220.82 |
204.37 |
213.25 |
246.47 |
302.42 |
247.09 |

The graph above is of Kolte Patil Developers. This a Realty developer company. If we look at the NI and EBITDA, they seem fairly stable with respective to each other. No high fluctuations in profitability numbers. Ignoring everything else and just based on the operating profits and net income, this seems to be a stable company. But when the component of CFO is added to these graphs the indication of stable changes to unstable very quickly. The CFO is all over the place, sometimes –ve when the NI was positive in 2014. Considering the condition of realty sector in India, the CFO numbers might make sense. But as an investor, I won’t feel safe with this business in my portfolio. This may also reveal any fudging or high number of bad debt, if any, which is not good for the future prospects of the company and its investor.
CGO:EBIT
But why stop at EBITDA-CFO when we can make the picture a little bit cleaner. The comparison should be of apples to apples to make sense. Or that might lead to undermining a variable over other for no reason. The problem with EBITDA-CFO is that EBITDA ignores the working capital changes like Accounts Receivables and Accounts Payables. And in NI-CFO, the tax increase or decrease may distort the operational profitability comparison.
Hence the concept of CGO:EBIT.


CGO is Cash generated from Operations. This number is before taxes. And as in India, the Interest expense is adjusted in CFO, the cash is before interest expense. This makes the CGO number directly comparable to EBIT and helps providing a cleaner picture. And CGO:EBIT ratio provides the information required information at one glance. Below are the graphs plotting CGO:EBIT ratio of Dmart and KPD.
|
DMART |
2014 |
2015 |
2016 |
2017 |
2018 |
2019 |
|
CGO:EBIT |
0.91 |
0.81 |
1.02 |
0.81 |
0.90 |
0.89 |

|
KPD |
2014 |
2015 |
2016 |
2017 |
2018 |
2019 |
|
CGO:EBIT |
-0.25 |
0.58 |
0.88 |
1.30 |
1.52 |
0.91 |

Just by glancing at the plotting on the graph, any sensible investor can differentiate between the two companies and come to the conclusion that KPD have relatively more unstable cash flows than Dmart.(aside from the fact that both companies operate in a different business environment)
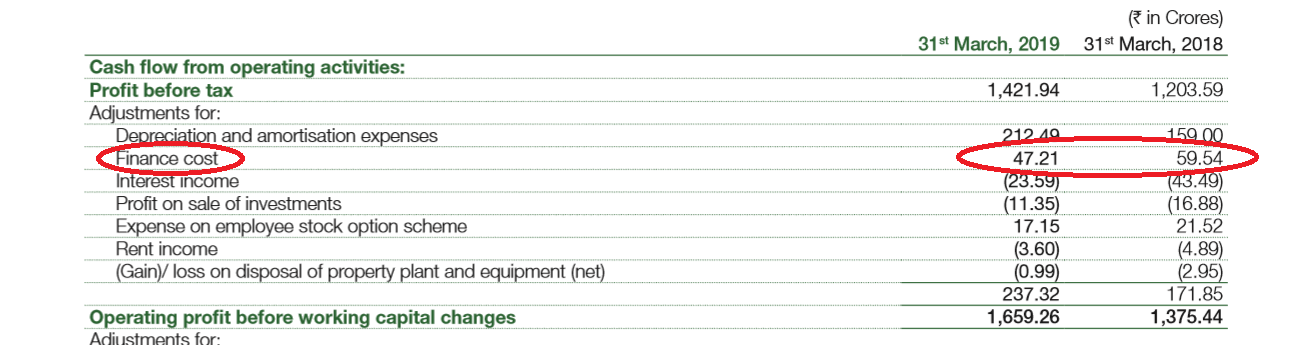

The above excerpts are from Dmart annual report 2018-19, which shows the adjustment for interest and the CGO number respectively in the Cash Flow Statement and how to come up with CGO number.
Hence, we can conclude by saying that revenue is not as same as cash and as the world follows accrual accounting, extra caution is to be taken as an investor so as not to invest in a company whose cash flow don’t support the claims made by its books.
By Sarang Zagade (Student of the market, CFA Level 1 Exam Candidate).
DISCLAIMER:
- · These are writer’s personal opinions and can vary from the facts.
- · Writer in no way is promoting a stock for buying or selling as many other factors are not taken into consideration.


Comments
Post a Comment